Bitcoin Marketcap
$1.23T
Gold Marketcap
$24.36T
BTC Settlement Volume (24hr)
$12.90B
BTC Inflation Rate (next 1yr)
1.17%
![]() CASEBITCOIN
making the case for bitcoin every day
CASEBITCOIN
making the case for bitcoin every day
Bitcoin Marketcap
$1.23T
Gold Marketcap
$24.36T
BTC Settlement Volume (24hr)
$12.90B
BTC Inflation Rate (next 1yr)
1.17%
![]() CASEBITCOIN
making the case for bitcoin every day
CASEBITCOIN
making the case for bitcoin every day
24hr change
Bitcoin Marketcap
$1.23T
BTC Inflation Rate (next 1yr)
1.17%
% Supply Issued
90.03%
BTC Settlement Volume (24hr)
$12.90B
Real Exchange Volume (24hr)
$26.51B
Active Addresses
1.02M
Mining Reward Value (24hr)
$59.8M
GBTC Premium
200.86%
MSTR Premium
-80.49%
BTC Down From ATH
48.28%
BTC Up From Cycle Low
8.44%
24hr change
24hr change
Gold:BTC (marketcap)
19.74x
-0.31
-1.56%
M2:BTC (marketcap)
18.67x
-0.24
-1.28%
BTC:Oil (price)
792.19x
+4.24
+0.54%
Gold:Oil (price)
48.62x
-0.51
-1.03%
30-day change
BTC vs Traditional Assets ROI:
Bitcoin
Gold
S&P 500
1 year:
-44%
+20%
+18%
2 year:
-4%
+67%
+34%
3 year:
+118%
+104%
+63%
4 year:
+185%
+133%
+87%
5 year:
+102%
+122%
+70%
6 year:
+589%
+116%
+128%
7 year:
+547%
+181%
+148%
8 year:
+764%
+226%
+165%
9 year:
+2,238%
+220%
+201%
10 year:
+9,900%
+202%
+242%
11 year:
+22,971%
+269%
+253%
12 year:
+10,553%
+207%
+274%
13 year:
+74,419%
+201%
+340%
14 year:
+765,466%
+154%
+448%
https://casebitcoin.com
Data Source: Messari.io, bitcoincharts.com
What is it: This shows bitcoin's ROI vs other potential inflation hedge assets.
Why it matters: As with the historical bitcoin price table, we see bitcoin's extreme outperformance vs other assets here as well. Bitcoin's relatively small size, plus fundamental properties, yield extreme outperformance when even relatively small funds-flows find their way to BTC.
Days Bitcoin Closed Above:
Price
Days Above
% of Bitcoin's Life
$70,000
458
7.15%
$65,299
584
9.12%
$60,000
757
11.82%
$50,000
927
14.47%
$40,000
1178
18.39%
$30,000
1423
22.21%
Data Sources: Messari.io, bitcoincharts.com
What is it: This the number of days in which bitcoin "closed" (trading level at midnight UTC) above various price levels.
Why it matters: This can give a sense of where bitcoin is currently trading relative to past cycles.


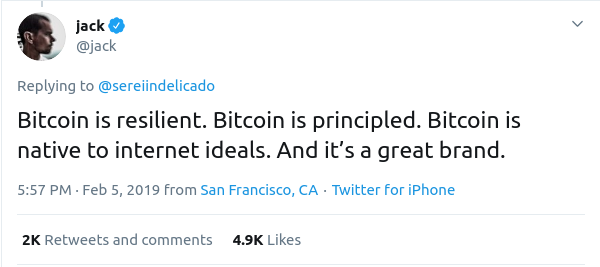
5 Feb 2019 | | Price when published: $3,461 (ROI since: +1,787%)
Filed under: ![]() fundamentals
fundamentals ![]() tweets
tweets
Since 2019, Jack Dorsey has considered Bitcoin likely to be the internet's currency.
https://twitter.com/jack/status/1092920168060088320
https://twitter.com/jack/status/1108487924742447104

What do you think of this piece?