Bitcoin Marketcap
$1.24T
Gold Marketcap
$25.05T
BTC Settlement Volume (24hr)
$12.90B
BTC Inflation Rate (next 1yr)
1.17%
![]() CASEBITCOIN
making the case for bitcoin every day
CASEBITCOIN
making the case for bitcoin every day
Bitcoin Marketcap
$1.24T
Gold Marketcap
$25.05T
BTC Settlement Volume (24hr)
$12.90B
BTC Inflation Rate (next 1yr)
1.17%
![]() CASEBITCOIN
making the case for bitcoin every day
CASEBITCOIN
making the case for bitcoin every day
24hr change
Bitcoin Marketcap
$1.24T
BTC Inflation Rate (next 1yr)
1.17%
% Supply Issued
90.03%
BTC Settlement Volume (24hr)
$12.90B
Real Exchange Volume (24hr)
$26.51B
Active Addresses
1.02M
Mining Reward Value (24hr)
$60.2M
GBTC Premium
200.86%
MSTR Premium
-80.49%
BTC Down From ATH
47.92%
BTC Up From Cycle Low
9.20%
24hr change
24hr change
Gold:BTC (marketcap)
20.15x
+0.05
+0.24%
M2:BTC (marketcap)
18.54x
+0.03
+0.17%
BTC:Oil (price)
746.51x
-18.88
-2.47%
Gold:Oil (price)
46.77x
-1.06
-2.22%
30-day change
BTC vs Traditional Assets ROI:
Bitcoin
Gold
S&P 500
1 year:
-45%
+21%
+18%
2 year:
-2%
+71%
+37%
3 year:
+119%
+111%
+65%
4 year:
+191%
+139%
+89%
5 year:
+89%
+129%
+70%
6 year:
+585%
+118%
+132%
7 year:
+569%
+191%
+148%
8 year:
+714%
+236%
+164%
9 year:
+2,479%
+229%
+202%
10 year:
+9,894%
+212%
+245%
11 year:
+22,458%
+280%
+261%
12 year:
+10,950%
+216%
+278%
13 year:
+73,593%
+212%
+344%
14 year:
+737,357%
+155%
+445%
https://casebitcoin.com
Data Source: Messari.io, bitcoincharts.com
What is it: This shows bitcoin's ROI vs other potential inflation hedge assets.
Why it matters: As with the historical bitcoin price table, we see bitcoin's extreme outperformance vs other assets here as well. Bitcoin's relatively small size, plus fundamental properties, yield extreme outperformance when even relatively small funds-flows find their way to BTC.
Days Bitcoin Closed Above:
Price
Days Above
% of Bitcoin's Life
$70,000
458
7.15%
$65,760
574
8.96%
$60,000
760
11.86%
$50,000
930
14.51%
$40,000
1181
18.43%
$30,000
1426
22.25%
Data Sources: Messari.io, bitcoincharts.com
What is it: This the number of days in which bitcoin "closed" (trading level at midnight UTC) above various price levels.
Why it matters: This can give a sense of where bitcoin is currently trading relative to past cycles.


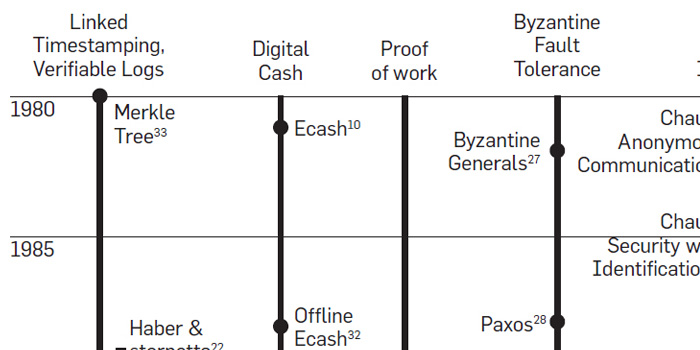
Truly digital cash was a goal in cryptography circles since the 1980s. The foundations were laid in the 1970s with the advent of usable public-key cryptography. A number of cryptographers (and "cypherpunks") realized that private digital cash, not controlled by any person, corporation, or nation-state was possible, and various efforts toward this end were undertaken.
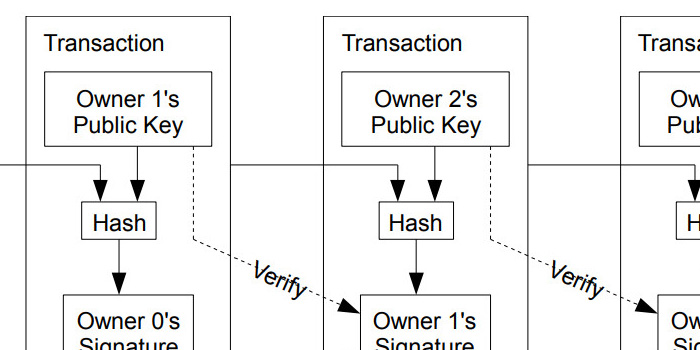
But there were problems. While the core cryptography making digital money theoretically possible existed since the 1980s, the incentive structures to control inflation & distribution of the money supply, as well as an elegant solution to the "double spending problem" did not exist until Satoshi Nakamoto published the bitcoin whitepaper in Oct 2008.
Pieces About Bitcoin as a Breakthrough in Computer Science