Bitcoin Marketcap
$1.18T
Gold Marketcap
$14.06T
BTC Settlement Volume (24hr)
$12.90B
BTC Inflation Rate (next 1yr)
1.17%
![]() CASEBITCOIN
making the case for bitcoin every day
CASEBITCOIN
making the case for bitcoin every day
Bitcoin Marketcap
$1.18T
Gold Marketcap
$14.06T
BTC Settlement Volume (24hr)
$12.90B
BTC Inflation Rate (next 1yr)
1.17%
![]() CASEBITCOIN
making the case for bitcoin every day
CASEBITCOIN
making the case for bitcoin every day
24hr change
Bitcoin Marketcap
$1.18T
BTC Inflation Rate (next 1yr)
1.17%
% Supply Issued
90.03%
BTC Settlement Volume (24hr)
$12.90B
Real Exchange Volume (24hr)
$19.84B
Active Addresses
1.02M
Mining Reward Value (24hr)
$57.4M
GBTC Premium
223.09%
MSTR Premium
71.44%
BTC Down From ATH
15.20%
BTC Up From Cycle Low
10.63%
24hr change
24hr change
Gold:BTC (marketcap)
11.90x
+0.06
+0.54%
M2:BTC (marketcap)
17.63x
+0.09
+0.50%
BTC:Oil (price)
791.65x
-8.49
-1.06%
Gold:Oil (price)
29.28x
-0.15
-0.51%
30-day change
BTC vs Traditional Assets ROI:
Bitcoin
Gold
S&P 500
1 year:
+126%
+14%
+26%
2 year:
+95%
+24%
+29%
3 year:
+9%
+26%
+22%
4 year:
+584%
+36%
+77%
5 year:
+822%
+80%
+80%
6 year:
+583%
+76%
+91%
7 year:
+3,480%
+89%
+116%
8 year:
+13,734%
+83%
+150%
9 year:
+25,831%
+95%
+146%
10 year:
+14,091%
+79%
+174%
11 year:
+54,240%
+61%
+217%
12 year:
+1.3 million%
+46%
+282%
13 year:
+861,551%
+54%
+285%
14 year:
+1.5 billion%
+87%
+345%
https://casebitcoin.com
Data Source: Messari.io, bitcoincharts.com
What is it: This shows bitcoin's ROI vs other potential inflation hedge assets.
Why it matters: As with the historical bitcoin price table, we see bitcoin's extreme outperformance vs other assets here as well. Bitcoin's relatively small size, plus fundamental properties, yield extreme outperformance when even relatively small funds-flows find their way to BTC.
Days Bitcoin Closed Above:
Price
Days Above
% of Bitcoin's Life
$70,000
10
0.18%
$62,534
78
1.39%
$60,000
108
1.93%
$50,000
229
4.09%
$40,000
480
8.57%
$30,000
725
12.94%
Data Sources: Messari.io, bitcoincharts.com
What is it: This the number of days in which bitcoin "closed" (trading level at midnight UTC) above various price levels.
Why it matters: This can give a sense of where bitcoin is currently trading relative to past cycles.


21 Nov 2014 | | Price when published: $353.61 (ROI since: +17,585%)
Filed under: ![]() fundamentals
fundamentals ![]() blogs
blogs
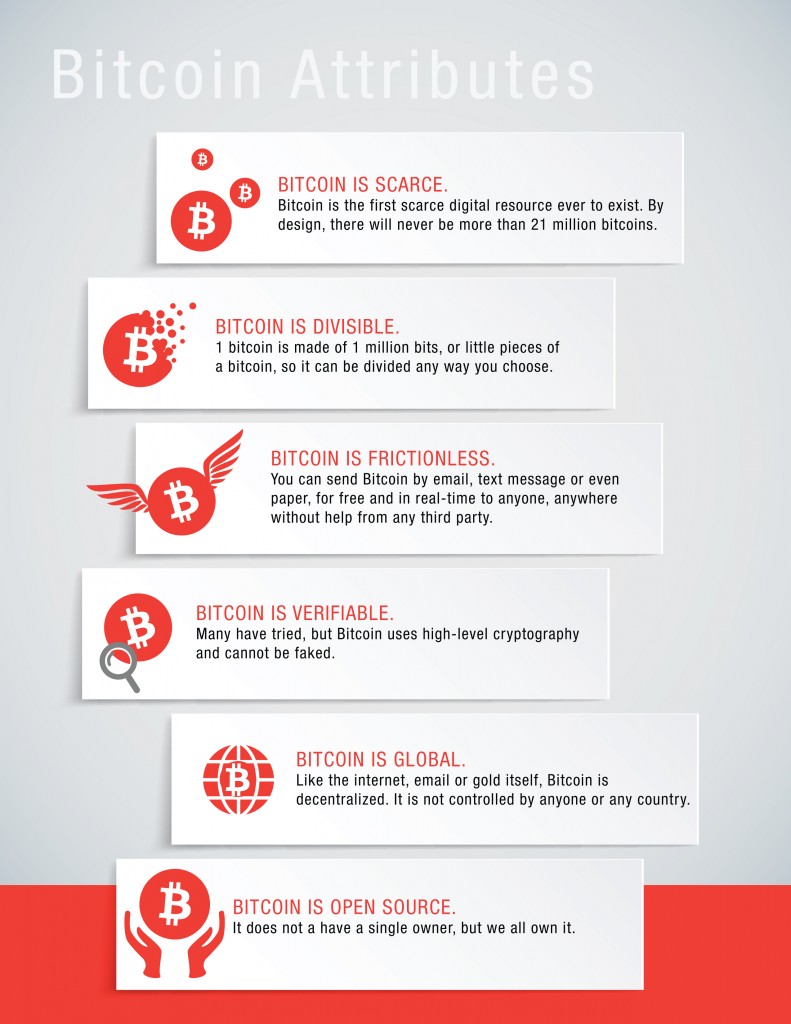
Bitcoin is the first form of truly digital money, built from the ground up and designed for an era of information rather than patched together with duct tape. Consider the following attributes:
What do you think of this piece?