Bitcoin Marketcap
$1.27T
Gold Marketcap
$14.84T
BTC Settlement Volume (24hr)
$12.90B
BTC Inflation Rate (next 1yr)
1.17%
![]() CASEBITCOIN
making the case for bitcoin every day
CASEBITCOIN
making the case for bitcoin every day
Bitcoin Marketcap
$1.27T
Gold Marketcap
$14.84T
BTC Settlement Volume (24hr)
$12.90B
BTC Inflation Rate (next 1yr)
1.17%
![]() CASEBITCOIN
making the case for bitcoin every day
CASEBITCOIN
making the case for bitcoin every day
24hr change
Bitcoin Marketcap
$1.27T
BTC Inflation Rate (next 1yr)
1.17%
% Supply Issued
90.03%
BTC Settlement Volume (24hr)
$12.90B
Real Exchange Volume (24hr)
$12.37B
Active Addresses
1.02M
Mining Reward Value (24hr)
$61.3M
GBTC Premium
242.04%
MSTR Premium
102.79%
BTC Down From ATH
9.14%
BTC Up From Cycle Low
18.54%
24hr change
24hr change
Gold:BTC (marketcap)
11.70x
+0.13
+1.14%
M2:BTC (marketcap)
16.44x
+0.01
+0.09%
BTC:Oil (price)
839.42x
+0.51
+0.06%
Gold:Oil (price)
30.59x
+0.41
+1.35%
30-day change
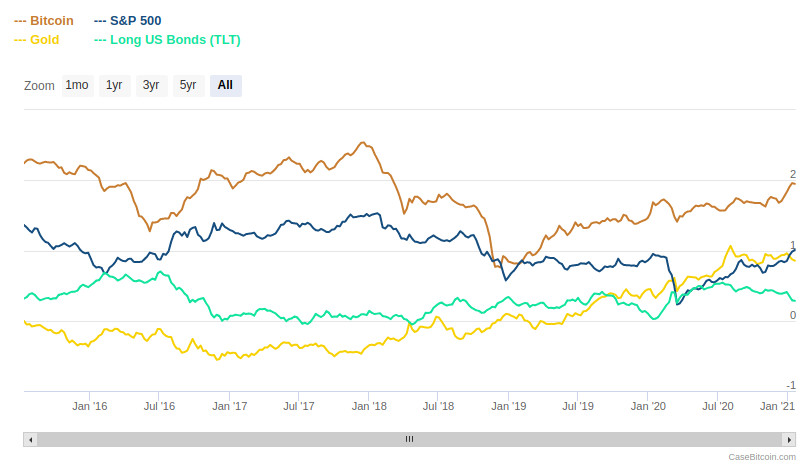
BTC vs Traditional Assets ROI:
Bitcoin
Gold
S&P 500
1 year:
+150%
+23%
+26%
2 year:
+125%
+32%
+34%
3 year:
+79%
+30%
+26%
4 year:
+637%
+41%
+80%
5 year:
+760%
+91%
+87%
6 year:
+720%
+90%
+95%
7 year:
+2,979%
+94%
+121%
8 year:
+15,118%
+95%
+159%
9 year:
+28,019%
+103%
+151%
10 year:
+12,652%
+89%
+178%
11 year:
+55,158%
+76%
+222%
12 year:
+1.3 million%
+57%
+302%
13 year:
+838,402%
+60%
+302%
14 year:
+1.4 billion%
+106%
+391%
https://casebitcoin.com
Data Source: Messari.io, bitcoincharts.com
What is it: This shows bitcoin's ROI vs other potential inflation hedge assets.
Why it matters: As with the historical bitcoin price table, we see bitcoin's extreme outperformance vs other assets here as well. Bitcoin's relatively small size, plus fundamental properties, yield extreme outperformance when even relatively small funds-flows find their way to BTC.
Days Bitcoin Closed Above:
Price
Days Above
% of Bitcoin's Life
$70,000
10
0.18%
$67,077
31
0.55%
$60,000
120
2.14%
$50,000
241
4.29%
$40,000
492
8.76%
$30,000
737
13.13%
Data Sources: Messari.io, bitcoincharts.com
What is it: This the number of days in which bitcoin "closed" (trading level at midnight UTC) above various price levels.
Why it matters: This can give a sense of where bitcoin is currently trading relative to past cycles.
21 Apr 2020 | | Price when published: $6,837 (ROI since: +881%)
Filed under: ![]() fundamentals
fundamentals ![]() blogs
blogs
Topics include:
- Gold's strengths and weaknesses
- Bitcoin's properties
- Absolute Scarcity
- Digital conveyance of wealth
- Proof of Work
- Decentralized network
- Peer to Peer
- Permanent, incorruptible, immutable public record
Bitcoin is a breakthrough technology and completely new kind of money. It is a borderless, decentralized, monetary system that allows anyone with a cell phone or internet to access its network. It fixes the problems associated with the printing of dollar bills, builds on the properties of gold, and ultimately surpasses both dollars and gold in utility as a store of value with a promise of becoming a globally recognized medium of exchange.
What do you think of this piece?